title:
style: nestedList # TOC style (nestedList|nestedOrderedList|inlineFirstLevel)
minLevel: 0 # Include headings from the specified level
maxLevel: 3 # Include headings up to the specified level
include:
exclude:
includeLinks: true # Make headings clickable
hideWhenEmpty: false # Hide TOC if no headings are found
debugInConsole: false # Print debug info in Obsidian console
MODULE 47.1: FIXED-INCOME INSTRUMENT FEATURES
Callable Bond
- Issuer has the right to buy back (redeem) the bond at a specified call price.
- Example timeline: sell a bond for $1,000 at t; issuer may call at $1,050 at t+1. At t+1:
- If market price is 1,100, issuer calls (investor’s upside is capped at the call price).
-
If market price is 1,000, issuer will not call.
-
Negative convexity: as yields fall and prices rise, upside is capped by the call feature; price rises less than for an option‑free bond.
- Value vs option‑free: callable bond value is lower than an identical non‑callable bond because the investor is short the call option.
MODULE 48.1: FIXED-INCOME CASH FLOWS AND TYPES
HAMMER THIS INTO YOUR HEAD
- This module has multiple kinds of cashflow structures, but they all boil down to how the principal is repaid over time, and are usually exposed to two main risks: reinvestment risk (getting your money back early and having to find a new place to put it) and credit risk (getting your money back late and trusting the issuer to still be around). Every bond structure is just choosing where on this spectrum you sit.
- Bullet structure = principal repaid only at maturity → you receive fixed coupons (interest-only payments) each period and get the full par value back at the end → this front-loads interest risk onto the issuer (if rates crash the issuer re-invests the coupons for peanuts) and back-loads credit risk onto you, because your entire principal is exposed until the final day (if issuer runs away i.e default you get nothing).
- Amortizing = you pay interest + some principal each period, but there's still a lump sum (balloon) left at maturity; fully amortizing = same blended payments but sized so the balance hits exactly zero on the last payment - no balloon, no surprise, you're done.
- This reduces your credit exposure over time but means earlier payments are interest-heavy while later payments are principal-heavy, so the cash-flow profile is the mirror image of a bullet bond.
- Constant payment formula ties these pieces together: $\(PMT = PV \times \frac{r}{1 - (1 + r)^{-N}}\)$ where \(PV\) = loan principal, \(r\) = periodic interest rate, \(N\) = number of periods. Notice the numerator is just the first period's interest charge; the denominator fraction adjusts it upward so each flat payment also chips away at principal until the balance is exactly zero.
- Sinking fund literally means the fund is sinking or eroding. That is forced partial principal repayment over the bond's life. The best example is suppose you are 70 years old with million dollars in savings. You want to spend this money before you die so you would make your savings sink. This means less principal outstanding at maturity → lower credit risk for you → you get your money back early and might redeploy at lower interest rate thereby increasing re-investment risk.
- Waterfall = priority queue for principal in ABSs and MBSs → pool sliced into tranches by seniority → senior gets all principal first → junior gets zero principal until senior is fully repaid → but both get interest throughout.
- Junior tranche absorbs losses first and receives principal last → this concentrates credit risk in the junior slice → which lets the senior tranche price like near-risk-free debt → investors in junior demand higher yield to compensate → that yield spread is the entire reason structured products exist.
- Floating-Rate Note (FRN) = your coupon floats with the market - think of it as a salary that adjusts for inflation: you get the Market Reference Rate (MRR - the going rate in the market) + a fixed credit spread (your premium for lending to this borrower, measured in basis points where 100 bps = 1%) → this kills reinvestment risk because your coupon resets each period, but it means you never lock in a high rate when rates are rising - you're always one reset behind.
- Step-up coupon = coupon rises on a preset schedule → compensates you for holding longer-dated risk → think of it as a loyalty raise - the issuer pays you more the longer you stay.
- Leveraged loan / credit-linked note = coupon rises when the issuer's credit deteriorates → e.g. debt/EBITDA (Earnings Before Interest, Taxes, Depreciation, and Amortization) crosses 3× and your spread jumps from MRR + 2.5% to MRR + 3% → it's an automatic insurance adjustment - the riskier the borrower gets, the more they pay you.
- Payment-in-Kind (PIK) = issuer pays your interest with more bonds, not cash → think of a friend who owes you money and "pays" you by writing a bigger IOU → the firm does this because it can't generate enough cash to service debt → you get higher yields but your entire return depends on the issuer eventually being good for it - if they default, all those extra bonds are worthless too.
- Green bonds = coupon penalizes the issuer for missing environmental targets → e.g. miss your CO₂ reduction goal and your coupon steps up → it's a put-your-money-where-your-mouth-is mechanism that aligns bondholder returns with sustainability outcomes.
- Inflation-linked bonds come in two flavors: interest-indexed (coupon adjusts for inflation but principal stays fixed - you're protected on income but your $1,000 par erodes in real terms) vs capital-indexed like Treasury Inflation-Protected Securities (TIPS) (coupon rate stays fixed but principal adjusts - so if inflation is 3%, your $1,000 becomes $1,030 and the fixed coupon applies to the bigger base, protecting both income and principal).
- Callable Bond: Think of your mortgage - when rates drop, you refinance and the bank loses a high-interest borrower. A callable bond is the same thing from the issuer's side. Rates fall from 6% to 4%, issuer calls your bond at $1,020, reissues at 4%, saves $19.20/year → you lose a 6% coupon and reinvest at 4%. This is call risk - your upside is capped at the call price (bond can't trade much above $1,020 even if rates collapse) but your downside is uncapped. Call protection period = the years before they can do this to you → you demand higher yield to accept this asymmetry.
- Putable Bond: Think of a job with a guaranteed severance - if things go bad, you can walk away and still get paid. A putable bond gives you the right to sell it back to the issuer at par. Rates spike from 4% to 7%, your bond's market value drops to $850, but you put it back at $1,000 and redeploy at 7% → you're protected on the downside. Real-world: in 2008, many corporate bonds crashed 20-30% in value - if you held a putable bond, you could force the issuer to buy it back at par while everyone else was stuck selling at \(700-\)800. You pay for this protection through a lower yield.
- Convertible = your right to swap the bond for the issuer's stock → you get bond safety (fixed coupons, principal protection) plus equity upside → issuer pays a lower coupon because you accepted stock optionality instead. Three numbers to know: conversion price (\(40/share), conversion ratio (\)1,000 ÷ $40 = 25 shares), conversion value (25 × current share price).
- Who holds the option determines who adjusts the price: callable bond sells cheaper than a straight bond (issuer has the option, you demand more yield) → putable bond sells richer (you have the option, you accept less yield) → convertible sells richer still (you have equity upside, issuer pays less coupon). The price gap between the option-embedded bond and the straight bond always equals the option's value.
- CoCo = emergency parachute for banks → bank starts losing money and equity drops below the regulatory minimum, your bond automatically becomes stock → debt shrinks, equity fattens, regulators happy. You went to sleep holding a bond and woke up holding stock in a struggling bank - worst possible moment to become a shareholder.
- Where a bond is issued, traded, and what currency it's in = three separate things that determine which laws apply and what yield you get.
- Domestic = issued and traded in issuer's home country
- Foreign = issuer sells in another country's market (UK firm issuing USD bonds in the US)
- Eurobond = issued outside any single country's jurisdiction, any currency (Chinese firm issuing yen bonds outside Japan) → less regulation, which is the whole point
- Global bond = trades both domestically and in the Eurobond market
- Currency matters most — a USD bond's yield is driven by US rates regardless of who issued it or where
- Bearer bond = whoever holds the paper owns it (old style); Registered = ownership recorded (modern standard)
- Sukuk = Islamic-compliant bond where payments are structured as rent on assets, not interest, to satisfy Sharia law
FIXED INCOME MARKETS FOR CORPORATE ISSUERS
- Uncommitted line = no legal obligation on the bank → holds zero capital → costs you nothing upfront but bank can say no anytime. e.g. a small retailer uses this to cover a 30-day inventory gap - works fine in calm markets, bank pulls it the moment the economy wobbles.
- "Anytime" means exactly when markets are stressed and you need it most → can't build a funding plan around it → you need something the bank is contractually stuck with. e.g. 2008 - firms relying on uncommitted lines found them gone overnight, forced into panic asset sales.
- Committed line = bank signs a legal promise → must hold capital against it → charges you ~0.50% commitment fee to recover that cost, drawn or not. e.g. a mid-size manufacturer keeps a $50M committed line as a liquidity buffer - pays $250K/year just to have it available.
- Large borrowers make the capital burden on one bank too big → banks syndicate, each taking a fixed slice → spreads burden without reducing your access. e.g. a $2B committed facility for a multinational split across 10 banks, each holding $200M - no single bank breaks a sweat.
- Revolver = committed line made multiyear + covenants added → lender locks in control before things go wrong → you give up flexibility but finally have funding you can budget around. e.g. Apple's $10B revolver sits undrawn as a backstop - the covenant structure means lenders get early warning, Apple gets certainty.
- Unsecured credit requires credit quality you might not have → secured loans solve this by pledging assets (receivables, inventory, fixed assets) → lender files a lien → you get the loan but your balance sheet now advertises the pledge to every future creditor.
- Receivables can either be assigned (you keep collecting, asset is just collateral) or sold to a factor (factor takes over collections at a discount) → factoring is faster cash but costlier → discount size depends on receivable quality and collection difficulty. e.g. a mid-size supplier factors $10M in invoices at 5% discount → gets $9.5M today instead of waiting 90 days.
- Strong companies skip bank loans entirely → issue commercial paper (CP) in public markets → matures in <3 months → cheaper than bank debt but creates rollover risk (can't always reissue at maturity). e.g. GE Capital rolled CP continuously pre-2008 - when markets froze, it couldn't roll → needed emergency Fed support.
- Rollover risk on CP → investors demand a committed backup line as a condition → now you're paying bank commitment fees and CP issuance costs → the backup line is the safety net that makes CP viable. e.g. Apple issues CP backed by its revolver - if markets seize up, it draws the revolver to repay maturing paper instead.
- Demand deposits = withdrawable anytime (meaning the bank could lose the funding any given day) → but fee rebates and credit lines keep commercial clients sticky → so banks treat this as reliable base funding despite the theoretical daily withdrawal risk.
- Certificates of deposit (CDs) solve the stability problem formally → fixed maturity + fixed rate locks the depositor in → non-negotiable CD penalizes early exit → negotiable CD trades in open market so the depositor can exit without breaking the contract → large-denomination CDs become wholesale funding from institutional investors, same role as commercial paper (CP) but in deposit form.
- The interbank market fills daily reserve gaps (banks are legally required to hold minimum reserves at the central bank - some have too much, some too little) → surplus banks lend to deficit banks at the central bank funds rate → if a bank can't borrow even here, it goes to the central bank's discount window, which costs more, requires collateral, and invites regulatory scrutiny.
- Banks also fund themselves using asset-backed commercial paper (ABCP - short-term notes backed by a pool of loans, not the bank's own creditworthiness) → the bank sells its loans to a special purpose entity (SPE - a legally separate shell company created just to hold those loans) → the SPE issues ABCP to investors and repays them from loan cash flows → the bank gets cash today without the loans sitting on its balance sheet.
- Example. a bank holds $500M in car loans → sells them to an SPE → SPE issues ABCP to money market funds → money market funds get short-term paper backed by car loan repayments → bank gets $500M cash immediately → if the car loan pool performs badly or investors stop buying ABCP at maturity, the SPE can't roll the paper → bank's backup liquidity line gets drawn → the risk the bank thought it had moved off its books comes straight back.
REPURCHASE AGREEMENTS
- Repo = you sell a security today and contractually agree to buy it back tomorrow at a higher price → the price difference is the interest → the security itself is the collateral → it's just a collateralized short-term loan dressed in sale language.
- Repo rate = annualized interest implied by the gap between sell price and buyback price → lower than unsecured borrowing rates because the lender holds your security as protection.
- Repo has two legs → opening leg: lender sends cash, borrower sends securities → closing leg: borrower sends back more cash than received and gets securities back → the extra cash paid at closing is the interest.
-
Lender doesn't lend the full market value of the security → divides by initial margin (>1) to create a buffer: $\(\text{Purchase Price} = \frac{\text{Market Value}}{\text{Initial Margin}}\)$ $\(= \frac{\)1{,}000{,}000}{1.03} = \(970{,}874\)$ Initial margin > 1 means you always get less cash than your collateral is worth - the lender keeps a cushion.
-
Haircut = the percentage chunk the lender shaves off your collateral value: $$\text{Haircut} = 1 - \frac{1}{\text{Initial Margin}} = 1 - \frac{1}{1.03} = 2.91 $$Haircut and initial margin say the same thing - haircut is the loss percentage, margin is the ratio form of it.
-
Repurchase price = loan amount grown at the repo rate, scaled down for the actual number of days: $\(\text{Repurchase Price} = \text{Purchase Price} \times \left[1 + \text{Repo Rate} \times \frac{\text{Days}}{360}\right]\)$ $$= $970{,}874 \times \left[1 + 0.02 \times \frac{90}{360}\right] = \(975{,}728\)$ Same as simple interest on a loan - rate times time, no compounding.
-
If collateral market value drops during the repo term → the cushion the lender built in via initial margin starts eroding → lender issues a variation margin call (a demand for additional collateral to restore the original buffer) → failure to post means the lender can seize and sell the collateral immediately.
- _e.g. you repo a bond worth $1,000,000 at 103% initial margin → lender gives you $970,874 → bond price falls to $950,000 → required loan value is now \(\frac{\)950{,}000}{1.03} = \(922{,}330\) → your outstanding loan of $970,874 now exceeds this → lender demands $970,874 − $922,330 = $48,544 in additional collateral immediately.
- Repo serves three players differently → banks and financial institutions use it to borrow cash against securities they already hold → institutional investors (mutual funds, pension funds) use it to earn the repo rate on idle cash → central banks use it to control money supply (buying securities injects cash, selling pulls it back).
- Hedge funds use repo in reverse → they lend cash to borrow a specific security (called a "special trade") → immediately sell that security in the open market → buy it back cheaper later → return it to the repo counterparty at maturity → profit = price drop on the security minus the repo rate they paid; if the security is very hard to borrow, the hedge fund may accept a negative repo rate just to get their hands on it._
- Repo rate moves with four levers → higher when money market rates rise (repo competes with alternatives) → higher when repo term is longer → lower when collateral is high quality or in short supply (lender wants that security) → higher when collateral is not actually delivered to the lender (undercollateralized = more risk = more compensation demanded).
HAMMER THIS INTO YOUR HEAD
WHEN REPO RATES ARE HIGHER?
One question covers everything: what's my risk, what are my alternatives, and how badly do I want that collateral?
Imagine yourself as the lender, you're handing over cash and holding a security as protection. If market rates are high, you have better places to put that cash, so you demand more to stay. If the term is long, more can go wrong, so again you charge more. If the borrower keeps the security at their end without delivering it to you, you can't sell it if they default means higher rate. The one exception: if the collateral is a scarce, in-demand security, you actually want it on your books temporarily, so you're willing to accept less.
- Tri-party repo solves the operational risks but not credit risk → a third party custodian (usually a large bank or clearinghouse) sits between the two sides → handles collateral valuation, margining, and settlement → reduces margining and netting risk → bilateral repo (no third party) is cheaper but leaves both sides managing all of this themselves.
MODULE 52.1: FIXED INCOME BOND VALUATION
- If 2 year YTM is 4.3% and 5 year YTM is 5.2%, what is the 3 year forward rate. \((1.052^5 / 1.043^2)^{(1/3)} - 1 = 5.81\%\)
- Matrix pricing uses the yields of actively traded bonds with similar credit quality, coupon rates, and maturities to estimate the yield of an illiquid bond. The process relies on linear interpolation to estimate the yield-to-maturity for the target bond's specific maturity date.
- Matrix Pricing: Recipe is to first calculate interpolated YTM using the given info and then compute PV
QUESTION
Price Interpolation
Rob Phelps, CFA, is estimating the value of a nontraded 4% annual-pay, A+ rated bond that has three years remaining until maturity. He has obtained the following yields to maturity on similar corporate bonds: A+ rated, 2-year annual-pay, YTM = 4.3% A+ rated, 5-year annual-pay, YTM = 5.1% A+ rated, 5-year annual-pay, YTM = 5.3% Estimate the value of the nontraded bond.
If 2 year YTM is 4.3% and 5 year YTM is 5.2%, what is the 3 year interpolated YTM. \(\Delta YTM (\text{3y}) = 5.2-4.3 = 0.9\). YTM increases by 0.9/3 = 0.30 per year. So 3-year straight line approximate YTM: 4.3+0.3 = 4.6%
Now: I/Y = 4.6, N = 3, FV = 100, PMT = 4, PV = -98.353
Using Spreads
Consider the following market yields: 4-year, U.S. Treasury bond, YTM 1.48% 5-year, A rated corporate bond, YTM 2.64% 6-year, U.S. Treasury bond, YTM 2.15% Estimate the required yield spread on a newly issued 6-year, A rated corporate bond
5y YTM of US Treasury = 1.48 + (2.15-1.48)/2 = 1.480 + 0.335 = 1.815% A rated bond spread = 2.640 - 1.815 = 0.825 6y YTM = 2.150 + 0.825 = 2.975
- The 'constant-yield price trajectory' illustrates how a bond's price moves toward par value as time passes, assuming the issuer does not default.
- The YTM calculation assumes the investor holds the bond until maturity. It assumes the issuer makes all coupon and principal payments as scheduled without default. It assumes all coupon payments are reinvested at the calculated Yield-to-Maturity.
- Generally, for the same change in market discount rates, a longer-term bond will experience a greater percentage price change than a shorter-term bond because the longer maturity bond has more cashflows that suffer the wrath of discounting.
- A lower-coupon bond will typically have a higher percentage price change than a lower-coupon bond when market discount rates change by the same amount. Lower coupon bond has higher interest rate risk (greater percentage price change) because a larger proportion of its value comes from the final principal payment, which is more sensitive to discounting. A higher coupon bond returns cash sooner, reducing duration.
- Convexity is optimistic. The convexity effect implies that for the same absolute change in yield, the percentage price increase when yields fall is greater than the percentage price decrease when yields rise.
- The Actual/Actual method counts actual calendar days, which includes weekends, holidays, and leap days; it does not exclude them. Government bonds typically use Actual/Actual to be precise. #memorise
- The 30/360 day count convention assumes each month has 30 days and the year has 360 days, and is often used for corporate bonds. #memorise
- The flat price (or clean price) is the quoted price. It excludes accrued interest so that the price does not appear to drop significantly solely because a coupon payment was made.
- The full price, also known as the invoice price, is equal to the flat price plus accrued interest. The full price includes accrued interest, which accumulates linearly between coupon dates and drops to zero immediately after a coupon payment.
QUESTION
A 4% annual coupon bond matures in 3 years. The market discount rate is 5%. The last coupon was paid 90 days ago. The coupon period is 360 days (30/360). What is the Full Price (Dirty Price)?
Revalue the bond with 2.75 years remaining: N = 2.75, I/Y = 5, PMT = 4, FV = 100 -> PV = 97.48
Calculate lost coupon (accrued interest) = 90/360 \(\times\) 4 = 1
Price = 98.48
QUESTION
A bond has a Full Price of 102.45. The semiannual coupon is 3.5% (annual rate). Settlement is 60 days into a 182-day coupon period. What is the Flat Price?
Coupon = 3.5 Accrued Interest (linear) = 3.5 / 365 \(\times\) 60 = 0.58 Flat price = Full price - Accrued Interest = 101.87
- The forward rate represents the marginal interest rate required to extend an investment for one additional period to break even with a longer-term spot investment.
HAMMER THIS INTO YOUR HEAD
What are Strips? - Each coupon payment → becomes its own zero-coupon bond. The principal repayment → also becomes a zero-coupon bond.
Bond: Face value 100, maturity 3 years, annual coupon 10%.
- STRIP 1 (ZCB): pays 10 in Year 1
- STRIP 2 (ZCB): pays 10 in Year 2
- STRIP 3 (ZCB): pays 110 in Year 3
Discount each Strip by YTM and you get the ZCB price.
Important things is to know is implication:
If the price of a bond calculated using the spot rate curve (theoretical price) is lower than the market price of the bond -> Bond is overvalued. Sell the bond, replicate its cash flows cheaper using strips → lock risk-free profit.
Title
A 10-year, 8% annual coupon bond is purchased at a premium price of 115.00 (Yield = 6.00%). Assuming the yield remains constant at 6.00%, what is the expected price of the bond 1 year later (9 years to maturity)?
MODULE 53.1: YIELD AND YIELD SPREAD MEASURES FOR FIXED-RATE BONDS
- Yield to maturity (YTM): the single rate that makes the present value of all coupon and principal payments equal to today’s price. For semiannual coupons, the quoted YTM is 2 × (half‑year rate).
- Periodicity and effective annual yield (EAY): more coupon periods per year means more compounding. Always compare bonds on EAY if payment frequency differs.
- Street vs true yield: street uses stated coupon dates; true shifts payments that land on weekends/holidays to the next business day, making true yield slightly lower.
- Income measures: current yield = annual coupon ÷ flat price. Simple yield adjusts current yield for straight‑line amortization of discount/premium.
- Calls and “worst” yield: compute a yield to call (YTC) for each call date/price. Yield to worst (YTW) is the lowest of YTM and all YTCs.
- Spreads to benchmarks: G‑spread = bond yield minus government yield (same or interpolated maturity). I‑spread = bond yield minus swap rate (same tenor).
- Reading spread moves: if the bond yield changes but its spread does not, the benchmark moved (economy‑wide). If the spread changes, the issuer/issue changed (credit, liquidity, tax).
- Curve‑aware spreads: Z‑spread is the constant number of basis points added to every point on the benchmark spot curve so discounted cash flows equal price. For embedded options, option‑adjusted spread (OAS) removes the option’s effect. For callables: OAS < Z‑spread.
MEMORISE
Effective annual yield (periodicity n):
Current and simple yield:
Government spread (G‑spread):
G SPREAD = Bond Yield − Government Yield (same maturity)
Zero Volatility Spread (Z-Spread)
Z‑spread over spot curve (solve for Z so price matches):
\[\sum_{t=1}^{T} \frac{CF_t}{\big(1 + s_t + Z\big)^{t}} = \text{Price}\]Callable bonds - option‑adjusted spread:
OAS = Z‑spread − Option cost
Yield to worst:
\[\text{YTW} = \min\big(\,\text{YTM},\ \{\text{YTC}_i\}\,\big)\]Notation in simple language: y = quoted YTM; n = coupons/year; s_t = benchmark spot rate at time t; Z = Z‑spread (in decimal); bp = basis points (1 bp = 0.01%).
Quick checks
- Hold EAY fixed: higher periodicity → lower quoted YTM.
- “Yield moved, spread didn’t” → benchmark moved (economy‑wide).
- “Spread moved” → issuer/issue changed (credit/liquidity/tax).
- Callable: YTW is the smallest among YTM and all YTCs.
- Interpolate the benchmark yield when exact maturity is missing.
ZERO‑COUPON: QUOTED YTM (SEMIANNUAL BASIS)
Problem A 15‑year zero with $1,000 par trades at $331.40. Find the quoted YTM on a semiannual bond basis.
Solution: $\(N=30,\ PMT=0,\ FV=1000,\ PV=-331.40 \Rightarrow I/Y_{\tfrac{1}{2}\,yr}=3.750\%\)$ Quoted YTM = 2 × 3.750% = \textbf{7.500%}. Explanation: The calculator’s I/Y is per half‑year; bond‑basis quotes double it.
G‑SPREAD WITH INTERPOLATED BENCHMARK
Problem: A 3‑year, 8% semiannual‑pay bond is priced at 103.165. Treasury 1y = 3.0%, 4y = 5.0%. Compute the G‑spread.
Solution: Bond YTM: \(N=6,\ PMT=4,\ FV=100,\ PV=-103.165 \Rightarrow\) I/Y (per half‑year) = 3.408% → quoted = \textbf{6.82%}. Interpolated 3y Treasury: \(3.0 + \tfrac{(3-1)}{(4-1)} (5.0-3.0) = \textbf{4.33\%}.\) G‑spread = 6.82 − 4.33 = \textbf{2.49% (249 bp)}. Explanation: Use nearest on‑the‑run government yields and linear interpolation for the missing maturity.
MODULE 54.1: YIELD AND YIELD SPREAD MEASURES FOR FLOATING-RATE INSTRUMENTS
HAMMER THIS INTO YOUR HEAD
When we do valuation of a floater we create cashflow coupons using quoted margin and discount them using discount margin or the required margin.
Remember this shortcut, whenever coupon rate exceeds discount rate, the bond trades at premium otherwise it trades at discount.
If your quoted margin is less than discount margin the bond trades at discount and vice versa
- The quoted margin is the specified spread, that is mentioned on the TnC of the bond, whereas the required margin (discount margin) is market-determined and can change with factors such as credit risk.
- Floaters with longer reset periods may be more exposed to interest rate and price volatility. The longer the reset period, the more a floater will behave similarly to a short-dated fixed-rate security.
- The quoted margin is the spread required by investors for the instrument to be priced at par on a reset date, and it is required margin.
HAMMER THIS INTO YOUR HEAD
- When a floater is quoted, investors ALWAYS quote the QUOTED MARGIN over the reference rate.
- The REQUIRED MARGIN (or DISCOUNT MARGIN) is the margin that investors actually require to hold the bond in the market. This is what market dictates.
- At inception, the REQUIRED MARGIN = QUOTED MARGIN, so the bond is priced at par.
- If credit quality worsens, investors demand a HIGHER REQUIRED MARGIN OR DISCOUNT MARGIN, so the bond price falls below par.
- Quoted margin pins the coupon.
- Required margin pins the price.
Question
A floating-rate note (FRN) has a face value of $10 million, total maturity 6 years, and pays coupons = reference rate + 2.5% margin. After 2.5 years, the issuer’s credit quality worsens and the market now demands a 3.5% margin (100 bps wider). The current flat spot curve is 4.1%, with semiannual payments. Compute the fair value of the FRN today.
After 2.5 years, 7 coupons remain, hence N = 7 PV, if nothing changed = 100 Margin widened by 1% (0.5 per 100 per coupon period) PV of 7 payments of 0.5 @ 2.05% = 3.23 So bond value should decline by 3.23 per 100 and bond should be priced at 96.77 per 100 For $10 million notional, price = $9,677,000 (rounding may give $9,697,600)
- Discount rate means interest is added on top of principal, not discounted. Price = Face Value − Interest for the period.
- Add-on rate means interest is calculated on the principal and added to it. Price = Face Value / (1 + Effective Yield).
DO NOT MAKE THIS MISTAKE
Look very very carefully if question gives you add-on rate or discount rate
PV when Add-on rate is given:
PV when Discount rate is given:
ADD ON YIELD
Calculate the price of a 180-day money market instrument with a face value of 10,000,000 quoted at an add-on rate of 3.65% based on a 365-day year.
Holding Period = 180/365 = N Effective Yield = 3.65% × 180/365 = 1.825% Price = 10 / (1.01825) = USD 9,823,183
DISCOUNT YIELD
A 90-day T-bill is quoted at a discount rate of 3.20% based on a 360-day year. The face value is 1,000,000. What is the purchase price of the T-bill?
Holding Period = 90/360 = 0.25 Effective Rate = 0.25 × 3.20% = 0.80% Interest = 1,000,000 × 0.008 = 8,000 Price = FV - Interest = 1,000,000 - 8,000 = 992,000t
ADD ON RATE VS DISCOUNT YIELD
A 90-day Bankers' Acceptance is quoted at a discount rate of 5.00% (360-day year). A 90-day CD is quoted at an add-on rate of 5.10% (365-day year). Which instrument offers the higher yield to the investor?
PV of Bankers Acceptance: HP = 90/360 = 0.25 HPY = 0.25 × 5.00% = 1.25% PV = 100(1-0.0125) = 98.75
PV of CD: HP = 90/365 = 0.2466 HPY = 0.2466 × 5.10% = 1.258% PV = 100 / (1 + 0.01258) = 98.76
MODULE 55.1: The Term Structure of Interest Rates - Spot, Par, and Forward Curves
Forward Rates - Intuition and No-Arbitrage
- Why “forward”: It is the implied rate for a future period, inferred today from longer-dated spot yields.
- No-arbitrage relation (annual compounding example): (1 + S2)^2 = (1 + S1) × (1 + 1y1yF) → 1y1y forward = (1 + S2)^2 / (1 + S1) − 1.
- Interpretation: Being indifferent between buying a 2-year zero today vs. rolling 1-year zero for two years implies this equality; otherwise, arbitrage exists.
Par rate: The yield-to-maturity for a given maturity that makes the present value of the bond’s cash flows equal to par (100% of face value).
Maturity Effect - Volatility Across Horizons
- Short-term rates/yields are typically more volatile than long-term rates because they reflect immediate policy and liquidity conditions, while long-term rates embed an average of expected short rates plus a term premium.
- Term premium compensates for uncertainty over long horizons; as maturity increases, instantaneous shocks are averaged across many expected future short rates, dampening volatility relative to short maturities.
Note: Premium bonds often have effective durations below time-to-maturity, as larger near-term coupons bring cash flows forward, reducing sensitivity to rate changes.
MODULE 57.1: Yield-Based Bond Duration Measures and Properties
MEMORISE
- Duration is the bond’s interest-rate sensitivity meter.
- Macaulay duration = weighted-average time to cash flows.
- Modified duration = percentage price sensitivity to a change in the bond’s own yield.
- Money duration and PVBP translate that sensitivity into actual currency moves.
- Duration exists because bond prices and yields move in opposite directions, but not all bonds move by the same amount. A tiny 1-year zero barely flinches. A long 30-year bond can get slapped around.
- So duration is just a cleaner answer to one question: if yield moves, how hard does this bond’s price get hit?
THE DURATION FAMILY
MEMORISE
- Macaulay = time.
- Modified = percentage price move.
- Money duration = currency move.
- PVBP = price move for 1 basis point.
- Macaulay duration is the present-value-weighted average time to receive the bond’s cash flows. It is still a time concept, not directly a price-change concept.
- Modified duration is what traders care about more day to day. It converts Macaulay duration into price sensitivity: $$ \text{ModDur} = \frac{\text{MacDur}}{1+r} $$
- Read that in plain English: modified duration tells you the approximate percentage change in full price for a change in the bond’s own yield-to-maturity.
- The key approximation is: $$ \% \Delta PV_{\text{Full}} \approx - \text{AnnModDur} \times \Delta \text{AnnYield} $$
- The minus sign is the whole bond market in one symbol: yields up, prices down; yields down, prices up.
FOR THE MATH GUYS
- Modified duration is the first derivative of bond price with respect to yield.
- It is the slope of the price-yield curve at today’s yield.
- Bigger slope in absolute value = more interest-rate risk.
- This is still a linear approximation, not the full curved story.
- If a bond has modified duration of 5, then a 100 basis point rise in yield means roughly a 5% price drop. That is the quick-and-dirty mental math.
- This is why higher modified duration means higher interest-rate risk. The price-yield line is steeper.
APPROXIMATE MODIFIED DURATION
MEMORISE
- Shock yield up a bit, shock yield down a bit, and measure the slope.
- This approximation is extremely close for plain bonds.
- It also becomes useful later when closed-form duration is messy.
- You do not always need to compute modified duration through Macaulay duration first. You can estimate it directly from prices: $$ \text{AnnModDur} \approx \frac{PV_- - PV_+}{2 \times \Delta \text{Yield} \times PV_0} $$
- Meaning:
- \(PV_0\) = current full price
- \(PV_+\) = price after a small yield increase
- \(PV_-\) = price after a small yield decrease
- This is just the slope estimate from a tiny bump up and tiny bump down in yield.
BRWA MODIFIED DURATION
Problem: A 5-year BRWA bond has annualized modified duration of 4.58676. What is the estimated percentage price change if its yield rises by 80 basis points?
\(\% \Delta PV_{\text{Full}} \approx -4.58676 \times 0.008 = -0.0367\) Estimated price change: about -3.67% If yield falls by 80 basis points, the estimate flips to +3.67% Takeaway: duration gives equal-and-opposite estimates because it is a straight-line approximation.
MONEY DURATION AND PVBP
MEMORISE
- Modified duration gives percentage move.
- Money duration gives cash move.
- PVBP gives the price move for a 1 basis point shift.
- Big portfolio + modest duration can still mean ugly money losses.
- Money duration is just modified duration translated into position size: $$ \text{MoneyDur} = \text{AnnModDur} \times PV_{\text{Full}} $$
- So instead of saying “the bond may move 4.3%,” you say, “this position may gain or lose EUR 4.3 million per 100 bp move,” depending on the position size.
- The price change in currency terms is: $$ \Delta PV_{\text{Full}} \approx - \text{MoneyDur} \times \Delta \text{Yield} $$
- PVBP, the price value of a basis point, is the estimated price change for a 1 bp change in yield. It is just a tiny money-duration slice: $$ \text{PVBP} \approx \text{MoneyDur} \times 0.0001 $$
Example
A bond can look “safe” because it is high quality, but if the position is huge, money duration can still be savage. That is how apparently boring rate moves turn into tens of millions of portfolio pain.
MONEY DURATION
Problem: A bond has annualized modified duration of 4, price 95, and yield rises by 50 basis points. Estimate the change in price per 100 of par.
Money duration = \(4 \times 95 = 380\) Price change \(\approx -380 \times 0.005 = -1.90\) Takeaway: percentage sensitivity becomes real money very quickly.
WHAT CHANGES DURATION
HAMMER THIS
- Longer maturity = more duration.
- Lower coupon = more duration.
- Lower yield = more duration.
- Duration falls as the bond rolls toward maturity.
- All else equal, a bond’s interest-rate risk rises when:
- time to maturity is longer
- coupon rate is lower
- yield-to-maturity is lower
- The intuition for longer maturity is simple: more of the bond’s value sits far in the future, and distant cash flows get hit harder when discount rates change.
- The intuition for lower coupon is that less cash comes back early, so more of the value gets pushed into the final principal payment. That makes the bond behave more like a zero-coupon bond, which is more rate-sensitive.
- The intuition for lower yield is that the discounting is gentler, so future cash flows keep more weight in today’s price. When those future-heavy cash flows dominate, duration rises.
Example
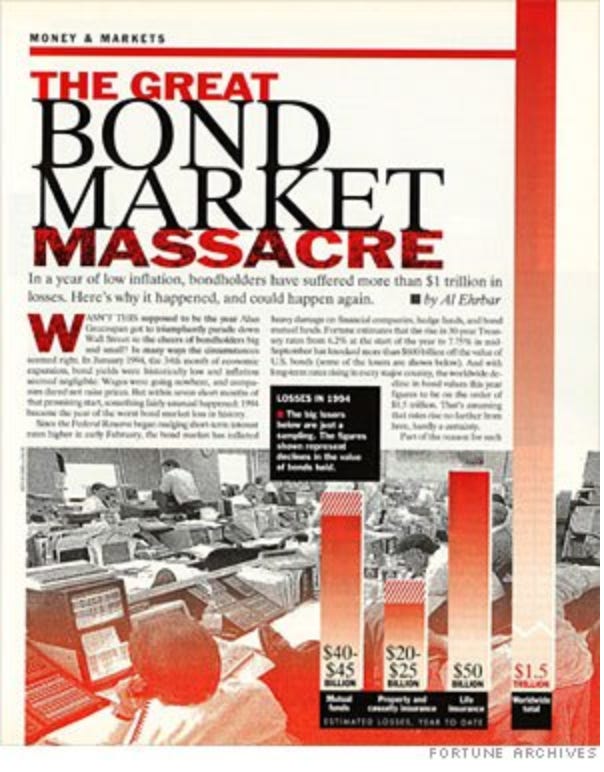
It was 1994. Bond investors had gotten comfortable. Rates had been calm, carry felt easy, and long bonds looked like safe, sleepy money. Then the Federal Reserve started tightening faster than the market expected. Yields jumped. And suddenly the trap snapped shut. The longest-duration bonds got hit the hardest because their cash flows were sitting far out in the future, where discount-rate changes do the most damage. That is the duration lesson in blood: you do not need default to get wrecked. If duration is huge and yields rise fast, price losses can turn savage very quickly.
- Duration is not static. As a bond moves closer to maturity, duration falls. Time itself slowly bleeds interest-rate risk out of the bond.
- One subtle exam point: if yield is negative, modified duration can actually be greater than Macaulay duration because you are dividing by a number less than 1.
- Another exam point: for a zero-coupon bond, Macaulay duration equals maturity, but modified duration is still less than maturity when yield is positive.
QUICK CHECKS
- Macaulay = time; modified = percentage sensitivity.
- Use full price, not flat price, in duration work.
- Convert basis points to decimals before multiplying.
- Bigger duration means steeper price response.
- Long maturity, low coupon, low yield = higher duration.
DO NOT DO THIS
- Don’t confuse Macaulay duration with modified duration.
- Don’t forget the minus sign in the price-change approximation.
- Don’t use flat price when the formula is about full price.
- Don’t assume duration stays constant as the bond ages.
MODULE 58.1: Yield-Based Bond Convexity and Portfolio Properties
Convexity of the Yield Curve
What is a convex function?
If \(f(x)\) is twice differentiable then \(f''(x) > 0\).
What does it mean?
In terms of rate of change, convexity means the rate of change itself is increasing; that is, acceleration is positive.
Convexity of the Yield Curve
Suppose we have a 1-period zero coupon bond. $$ P = FV (1+r)^{-t} $$ $$ \frac{dP}{dr} = -t(1+r)^{-t-1}\cdot FV < 0 $$ $$ \frac{d^2P}{dr^2} = t(t+1)(1+r)^{-t-2}\cdot FV > 0 $$ We see that the first derivative is negative and the second derivative is positive. Therefore, the function decreases at a decreasing rate. The positive second derivative implies that the slope is approaching zero, so the function is decelerating.
What does this mean intuitively?
At higher levels of yield, a small decline in yield causes a larger increase in bond price; at lower yields, the same decline will cause a smaller increase.
What is its implication?
In a high-yield environment, long-duration bonds (e.g., TLT) will gain sharply as yields fall.
Question
A non-callable, fixed-coupon bond has a price of 106.0625 and a YTM of 2.8%. If the YTM were to increase instantaneously by 80 bps, the price of the bond would decrease by 11%. If the YTM were to decrease instantaneously by 80 bps, the price of the bond would increase by:
FIXED INCOME MARKETS FOR CORPORATE ISSUERS
- Weak credit → secured borrowing. Firms with low credit ratings must pledge collateral. Strong credit firms issue commercial paper (CP) → unsecured, typically < 3 months maturity, used for working capital or temporary/bridge funding.
- Factoring Firm sells receivables to a lender at a discount. Lender takes over credit risk + collection. Example: ₹100 invoice sold for ₹95 today → instant liquidity.
- Bridge Financing refers to short-term funding used until permanent financing (bonds, equity) is arranged. A company plans to issue a 10-year bond in 3 months but needs cash now to run operations → it issues 3-month commercial paper today → when the bond is issued, the proceeds are used to repay the CP.
- Rollover = repaying old short-term debt by issuing new short-term debt instead of using cash. The risk that the company would not be able to sell a new commercial paper to repay the old one is known as rollover risk.
- Banks fund short-term mainly through deposits: checking, operational corporate deposits, savings, and certificates of deposit (CDs). For example, fixed deposits in India.
- Asset Backed Commercial Paper: A bank sets up a vehicle that buys car loans, then issues 30-day asset-backed commercial paper to investors, and keeps issuing new 30-day ABCP every month to repay the old ABCP, with the car loans as collateral. Cash to repay ABCP comes from loan EMIs first, new ABCP issuance next, money from sponsoring bank during bad days, and asset sales only as last resort.
- Repo = collateralised borrowing where one party sells a security today and agrees to buy it back later at a higher price; that price difference is the repo rate, i.e. the interest on the loan embedded in prices, not quoted separately.
- Example (India): An Indian bank needs overnight cash → it sells government bonds to the RBI for ₹100 today and agrees to repurchase them tomorrow for ₹100.02 → the ₹0.02 difference is the repo interest, and the bonds are the collateral.
- Collateral protection: lender demands collateral worth more than the cash lent to protect against price drops.
- Initial margin (haircut) = gap between collateral market value and loan amount → loan amount is a discount to collateral value. Collateral worth ₹105 is posted, but the lender gives only ₹100 cash → the ₹5 gap is the initial margin (haircut) protecting the lender if collateral prices fall.
- During the repo\u2019s life, if collateral value falls, borrower must post extra collateral → this top-up demand is variation margin.
- Overnight repo = one-day repo; term repo = repo longer than one day. Repo rates are usually lower than unsecured bank loans because the loan is backed by high-quality collateral (often government bonds).
- Repo rates are usually lower when the collateral liquidity is high and the collateral is physically delivered to the lender. Repo rates are usually higher when the term is high and when interest rates for alternative sources of funds are higher.
- Tri-party repo = repo where a third party (clearing bank/CCP) handles collateral custody, valuation, and margining; example: an Indian bank borrows overnight via repo using G-secs, while CCIL sits in the middle holding the bonds and settling cash.
- Reverse repo = the lender\u2019s side of a repo; example: a bank parks excess cash with the RBI, receives G-secs as collateral, and earns the reverse repo rate as interest.
- Tri Party repos protect against the following kinds of risks:
- Default risk = the borrower takes cash today and fails to repurchase the collateral later, forcing the lender to sell the collateral to recover money.
- Collateral risk = the value of the collateral falls sharply before it can be sold, so even after liquidation it does not fully cover the cash lent.
- Margining risk = collateral prices move faster than margin calls, so the lender is exposed during the time gap between a price fall and posting of additional collateral.
- Legal risk = in stress or bankruptcy, the repo is not enforced as expected, and courts may freeze or delay access to collateral by treating the repo like a normal loan.
- Netting risk = when a counterparty defaults, you cannot offset what you owe against what you are owed, so you must pay all obligations in full while recovering only partially on claims.
- Settlement risk = cash and securities do not settle simultaneously, so one party delivers cash while the collateral delivery fails or is delayed.
FIXED INCOME MARKET FOR GOVERNMENT ISSUERS
- Sovereign debt = bonds issued by national governments to fund public goods; backed by taxing power, usually the largest issuers in domestic markets, typically highest credit quality locally.
- Public-sector accounting focuses on cash flows; analysts should think in balance-sheet terms: implied assets (future taxes) versus liabilities (promised debt payments).
- Core divide: developed-market issuers borrow in stable, reserve currencies with deep markets and transparent fiscal policy; emerging-market issuers face higher volatility, weaker institutions, and funding constraints.
- Emerging-market debt is often split into domestic debt (local currency, local investors) and external debt (foreign currency, foreign creditors); external debt adds FX risk because repayment currency \u2260 tax currency.
- If a government earns in INR but owes USD debt, currency depreciation mechanically raises debt burden even if real activity is unchanged.
- Governments issue across maturities to balance cost and risk; too much short-term debt lowers rates today but raises rollover risk tomorrow.
- Rollover risk = inability to refinance maturing debt; classic crisis trigger when markets suddenly refuse to roll short-term bills.
- Debt management policy decides how much, what type, maturity, currency, and indexation (floating, inflation-linked) of debt is issued.
- Inflation-linked debt shifts inflation risk to the issuer; nominal fixed-rate debt shifts inflation risk to investors.
- Sovereign issuance is done via regular public auctions to signal transparency and price discovery. Competitive bids specify both price and quantity; noncompetitive bids accept the auction price and are guaranteed allocation.
- Government auctions ₹1,000 crore of a 10-year bond; competitive bidders submit bids like \u201c₹300 crore at 7.10%,\u201d \u201c₹400 crore at 7.15%,\u201d \u201c₹500 crore at 7.25%.\u201d Because the auction cleared (filled the quota) at the 7.25% tier, 7.25% is the cutoff yield.
- In a \u201csingle-price\u201d auction (also known as a Dutch auction), everyone pays the same yield→the highest yield accepted to sell the entire offering. If the government needs to sell bonds and the clearing rate is 4.0%, a bidder who aggressively bid 3.8% still gets the bonds at 4.0%, which encourages more aggressive bidding by removing the fear of overpaying. In a \u201cmultiple-price\u201d auction, winning bidders pay exactly what they bid; if you bid 3.8% and the clearing rate was 4.0%, you are stuck earning 3.8% while others earn more. This structure can reduce aggressive bidding because investors fear the \u201cwinner\u2019s curse\u201d→winning the auction but paying a price worse than the market average.
- Issuers wanting to minimize yield volatility often prefer single-price auctions; bidders shade less.
- On-the-run bonds = most recently issued securities at a given maturity; most liquid, used as benchmarks for risk-free rates. Yield curves in practice are built off on-the-run sovereign bonds, not off older illiquid issues.
- Primary dealers are designated banks obligated to bid in auctions and make secondary markets; they act as transmission channels for monetary policy. Central banks interact with primary dealers as counterparties when conducting open-market operations.
MODULE 54.1: YIELD AND YIELD SPREAD MEASURES FOR FLOATING-RATE INSTRUMENTS
- Coupon is reset periodically as per prevailing market reference rate + spread.
- On the reset date, the coupon resets to reference rate + quoted margin (50 bps), but investors require reference rate + required margin (75 bps), so the coupon is too low for the market.
- Therefore, the price will be below par, because the bond must trade at a discount so that coupon plus price pull-to-par together deliver the higher required margin.
- Between resets the bond still trades in the market and its price can move above or below par.
- It trades below par when the quoted margin is too low for current market conditions or issuer risk; example: an FRN pays SOFR + 150 bps, but new FRNs from similar issuers are coming at SOFR + 200 bps, so investors mark the old bond down to 98 so its yield matches the higher required spread.
- Quoted margin is the fixed spread added to the reference rate that defines the coupon on a floating-rate note; example: a FRN pays 3-month LIBOR + 150 bps, so if LIBOR is 5%, the coupon rate is 6.5%, and the 150 bps is the quoted margin written into the bond contract.
- Discount margin is the spread over the reference rate that makes the present value of all future cash flows equal to the bond\u2019s current market price; example: if the same FRN (LIBOR + 150 bps) trades below par at 98, investors effectively earn LIBOR + 180 bps, and the extra 30 bps over the quoted margin is captured by the discount margin.
- During issuance, QM = DM. If issuer credit quality deteriorates DM > QM, vice versa.
NUMERICAL
A $100,000 FRN with a semiannual coupon pays a 180-day MRR plus a quoted margin of 120 basis points. On a reset date with five years remaining to maturity, the 180-day MRR is quoted as 3.0% (annualized), and the discount margin (based on the issuer\u2019s current credit rating) is 1.5% (annualized). Estimate the value of the FRN.
Coupon Rate = (3.0% + 1.2%) / 2 = 2.1% PMT = 0.021 \(\times\) 100 = 2.1 I/Y = (3.0% + 1.5%) / 2 = 2.25% N = 10 FV = 100 PV = 98.67
- Discount yield quotes return as a percentage of face value, not money invested, and ignores compounding; example: a 1-year T-bill with face value 100 bought at 95 has discount yield = (100 \u2212 95)/100 = 5%, even though you invested only 95.
- Add-on yield quotes return as a percentage of amount invested, which reflects actual cash put in but still ignores compounding; example: the same bill bought at 95 has add-on yield = (100 \u2212 95)/95 \u2248 5.26%, higher than discount yield because it uses invested cash as the base.
NUMERICAL
- A $1,000 90-day T-bill is priced with an annualized discount of 1.2%. Calculate its market price and its annualized add-on yield based on a 365-day year.
HPY = 90/360 \(\times\) 1.2 = 0.3% PV = 1000 / 1.003 = 997
- A $1 million negotiable CD with 120 days to maturity is quoted with an add-on yield of 1.4% based on a 365-day year. Calculate the payment at maturity for this CD and its bond equivalent yield.
HPY = 120/365 \(\times\) 1.4 = 0.46% PV = 1 / 1.0046 = 956,000 Discounted yeild = (1 - 0.956) / 1 = 4.4%
- A bank deposit for 100 days is quoted with an add-on yield of 1.5% based on a 360-day year. Calculate the bond equivalent yield and the yield on a semiannual bond basis.
HPY = 100/360 \(\times\) 1.5 = 0.4166% PV = 100 / 1.004166 = 99.58 Discount Yield = (100-99)/100 = 4.2% Discount Yield (SemiAnnual) = 2.1%
MODULE 58.1: YIELD BASED BOND CONVEXITY AND PORTFOLIO PROPERTIES
MEMORISE
- Duration is the slope. Convexity is the bend.
- For an option-free fixed-rate bond, convexity is positive and valuable.
- Price accelerates as yields fall.
- Longer maturity, lower coupon, and lower yield all increase convexity.
- Portfolio convexity from weighted averages is practical, but it quietly assumes a parallel curve shift.
- Duration alone is only half the story. It tells you the first-order effect of yield changes on price, which is just the slope of the price-yield relationship.
- Convexity is the second-order effect. It tells you how that slope itself changes as yield moves. In plain English: duration gives the straight-line estimate, convexity fixes the miss because the real price-yield relationship is curved.
Example
Think of a long government bond when yields fall sharply. Duration says the price should rise by some amount. But the actual bond usually rises even more because the price-yield curve bows outward. That extra pop is convexity doing its job.
![[module58_convexity_curve.svg]]
- This is why convexity matters more for larger yield changes. For tiny moves, the straight-line duration approximation is fine. For bigger moves, ignoring curvature starts making you look silly.
- For an option-free fixed-rate bond, convexity is always positive. That is good news for you as an investor:
- when yields fall, price rises more than duration alone predicts
- when yields rise, price falls less than duration alone predicts
- That is why convexity is valuable. It makes the bond less nasty on the downside and more generous on the upside. But markets know this, so you usually pay for more convexity through a higher price and lower yield.
THE FORMULA LOGIC
MEMORISE
- Duration term = main move.
- Convexity term = always additive for an option-free bond.
- Convert basis points to decimals before touching the formula.
- Bigger yield move = convexity matters more.
- The standard approximation is: $$ \% \Delta PV_{\text{Full}} \approx (-\text{AnnModDur} \times \Delta \text{Yield}) + \left(\tfrac{1}{2} \times \text{AnnConvexity} \times (\Delta \text{Yield})^2\right) $$
- Read it like this:
- first term = duration effect
- second term = convexity adjustment
- The convexity adjustment gets added to the duration estimate. Because convexity is positive for an option-free fixed-rate bond, this term helps you on both sides.
FOR THE MATH GUYS
- Duration is the first derivative of price with respect to yield.
- Convexity is the second derivative.
- This price-change formula is just a second-order Taylor expansion around the current yield.
- Linear term first, curvature correction second.
PRICE CHANGE WITH CONVEXITY
Problem: A GBP 50,000,000 position in a 10-year 3.50% bond has annualized modified duration of 8.376 and annualized convexity of 81.701. Yields fall by 100 basis points. Estimate the percentage price change.
Duration effect: \(-8.376 \times (-0.01) = +0.08376 = +8.376\%\) Convexity adjustment: \(\tfrac{1}{2} \times 81.701 \times (0.01)^2 = 0.004085 = +0.4085\%\) Estimated total price change: about +8.78% Takeaway: when the move is large, convexity is not decoration. It adds real money.
- Money convexity is just convexity translated into currency terms. Instead of saying “the bond has convexity 81.701,” you ask “how many pounds or euros is that worth for this position size?”
- The idea is simple: $$ \text{Money Convexity} = \text{Annual Convexity} \times PV_{\text{Full}} $$
- Then the money convexity adjustment is: $$ \text{Money Convexity Adjustment} \approx \tfrac{1}{2} \times \text{Money Convexity} \times (\Delta \text{Yield})^2 $$
MONEY CONVEXITY
Problem: Use the same GBP 50,000,000 bond position with annualized convexity 81.701 and a 100 basis point rate decline. What is the money convexity adjustment?
Money convexity: \(81.701 \times 50{,}000{,}000 \approx GBP\ 4.085\) billion Money convexity adjustment: \(\tfrac{1}{2} \times 4.085\) billion \(\times (0.01)^2 \approx GBP\ 204{,}252\) Takeaway: that “small” convexity term can still mean more than GBP 200k on a big position.
WHAT MAKES CONVEXITY BIGGER
MEMORISE
- Longer maturity = more convexity.
- Lower coupon = more convexity.
- Lower yield-to-maturity = more convexity.
- Same story as duration, just even more curved.
- Bond features that increase convexity are the same ones that increase duration:
- longer time to maturity
- lower coupon rate
- lower yield-to-maturity
- Longer time to maturity: more of the bond’s value sits far out in the future, and distant cash flows react more dramatically when discount rates move. Long bonds live on the bendier part of the curve.
- Lower coupon rate: less cash comes back early, so more of the bond’s value is pushed into the final principal payment. That makes the bond behave more like a zero-coupon bond, which is highly curved.
- Lower yield-to-maturity: when discount rates are already low, the price-yield curve becomes steeper and more curved. A small change in yield now moves present values more violently.
- There is one extra intuition point: if two bonds have the same duration, the one whose cash flows are spread out more over time has higher convexity.
- The numbers make the point very clearly:
- Romanian 30-year bond: approximate modified duration about 15.91, approximate convexity about 369.64
- BRWA 5-year bond: approximate modified duration about 4.59, approximate convexity about 24.24
- That gap is huge. Same basic asset class, but the long bond is living in a much more curved world.
PORTFOLIO PROPERTIES
MEMORISE
- Portfolio duration and convexity are usually taken as market-value-weighted averages.
- That is practical, not perfectly “theoretical.”
- The hidden assumption is a parallel shift in the yield curve.
- Real curves rarely move that politely.
- In practice, portfolio managers usually calculate portfolio duration and convexity by taking the weighted averages of the durations and convexities of the individual bonds. This is easy and useful, which is exactly why everyone does it.
- But the curriculum makes an important distinction: the theoretically correct method is to calculate duration and convexity from the weighted average time to receipt of the aggregate cash flows of the whole portfolio.
- The weighted-average-of-bonds method is common because it is practical, but it quietly assumes a parallel yield curve shift.
Example
Silicon Valley Bank is the brutal real-world reminder. It stuffed itself with long-duration Treasury and mortgage-backed securities when yields were low. Then rates ripped higher in 2022–2023, the value of those bonds sank, and the unrealized losses became terrifying once depositors started pulling cash. The main villain here was duration because it drove the big price hit. Convexity matters too, but as the second-order amplifier: long bonds live on a more curved part of the price-yield relationship, so big rate moves become even less forgiving.

PORTFOLIO CONVEXITY
Problem: A EUR 100 million portfolio holds Bond A at 40% weight with modified duration 2.858 and convexity 9.752, and Bond B at 60% weight with modified duration 8.376 and convexity 81.701. Yields rise by 50 basis points. Estimate the portfolio percentage price change.
Portfolio modified duration: \((0.4 \times 2.858) + (0.6 \times 8.376) = 6.169\) Portfolio convexity: \((0.4 \times 9.752) + (0.6 \times 81.701) = 52.921\) Estimated price change: \((-6.169 \times 0.005) + \left(\tfrac{1}{2} \times 52.921 \times 0.005^2\right) \approx -3.018\%\) Takeaway: weighted averages make portfolio risk estimation fast, but they still rest on the parallel-shift assumption.
QUICK CHECKS
- Convexity is the curvature correction to duration.
- For an option-free fixed-rate bond, convexity is positive.
- More convexity helps you in both yield directions.
- Longer maturity, lower coupon, lower yield = more convexity.
- Portfolio weighted averages are practical but assume parallel shifts.
MODULE 59.1: CURVE-BASED AND EMPIRICAL FIXED-INCOME RISK MEASURES
MEMORISE
- Modified duration is the plain-vanilla tool. Effective duration is the option-bond tool.
- Effective duration and convexity come from repricing, not from a clean closed-form shortcut.
- Key rate duration is for twist/steepening/flattening moves, not one big parallel shrug.
- Empirical duration matters when spreads and government yields move together in the real world.
- This module exists because the curve does not move in same direction. Short rates, belly rates, and long rates can move by different amounts, and sometimes in opposite directions.
- Cash flows are not fixed because borrowers can prepay, issuers can call, or embedded options can change what you actually receive.
- That is why Macaulay and modified duration are not enough everywhere. They quietly assume a parallel shift and fixed cash flows.
MODIFIED VS EFFECTIVE
MEMORISE
- Option-free bond: modified duration is usually fine.
- Bond with embedded option or prepayment risk: use effective duration.
- Modified duration is formula-based. Effective duration is reprice-and-see.
- Memory hook: modified duration is pessimistic.
- Modified duration is your first-order sensitivity for a plain fixed-rate bond. It is the tangent-line estimate of price sensitivity to yield.
- Modified duration is pessimistic. It usually overstates the price drop when yields rise and understates the price gain when yields fall because it ignores curvature.
- Effective duration is brute-force duration. You shock the benchmark curve down, shock it up, reprice the bond both times, allow cash flows to change, and then measure the slope from those observed prices.
- That makes effective duration the right tool for callable bonds, putable bonds, and mortgage-backed securities, because those instruments change behavior when rates move.
- Keep the logic clean:
- Modified duration asks: “If yield moves a bit, what is the approximate price sensitivity if cash flows stay fixed?”
- Effective duration asks: “If the benchmark curve moves, what actually happens to price once the bond’s cash flows are allowed to react?”
WHY EFFECTIVE DURATION EXISTS
Problem: Why is modified duration not good enough for a callable bond?
Because the callable bond may get called when rates fall, so the cash flows themselves change. Modified duration assumes the cash flows stay fied. Effective duration reprices the bond after the rate move and captures that change directly. Takeaway: if the bond can change its own cash-flow path, use effective duration.
- The effective-duration formula is just a normalized slope: $\(\boxed{\text{Effective Duration}=\dfrac{PV_- - PV_+}{2\,\Delta \text{Curve}\,PV_0}}\)$
- Read it like a human:
- \(PV_-\) = price after the curve shifts down
- \(PV_+\) = price after the curve shifts up
- \(\Delta \text{Curve}\) = the size of the benchmark curve shock in decimals
- divide by \(PV_0\) so the answer becomes percentage sensitivity rather than raw dollars
CONVEXITY IN PLAIN ENGLISH
MEMORISE
- Callable bond: upside gets capped when yields fall, so convexity can turn negative.
- Putable bond: downside gets cushioned when yields rise, so convexity stays positive.
- Duration gives the main move. Convexity gives the correction.
- Effective convexity is the same concept as effective duration, just one order deeper. You reprice the bond after a small up-shift and down-shift in the benchmark curve and measure the curvature of the price response.
- This matters because duration alone is a straight-line approximation. Real price-yield relationships are curved, especially for large moves and especially when options start changing behavior.
- Callable bonds are the classic trap. When yields fall a lot, the issuer gets tempted to call. So your upside starts flattening out. That is negative convexity.
- Putable bonds are the opposite comfort blanket. When yields rise, the put feature helps protect the downside, so convexity remains positive.
- To estimate price change with effective measures, use: $\(\Delta P/P \approx -\text{Eff. D}\,\Delta\text{Curve} + \tfrac{1}{2}\,\text{Eff. Conv}\,(\Delta\text{Curve})^2\)$
- Translation: duration gives the big directional move, convexity fine-tunes it.
FOR THE MATH GUYS
- Duration is basically the first derivative of price with respect to yield: the slope.
- Convexity is the second derivative: how fast that slope itself changes.
- The price-change formula is just a second-order Taylor expansion around today’s yield.
- First term = linear approximation. Second term = curvature correction.
PRICE CHANGE USING EFF. D AND EFF. CONV.
Problem: Effective duration = 10.5, effective convexity = 97.3, and the curve falls by 200 basis points. Estimate the percentage price change.
Duration effect: \(-10.5 \times (-0.02) = +0.2100 = +21.00\%\) Convexity effect: \(\tfrac{1}{2} \times 97.3 \times (0.02)^2 = 0.0195 = +1.95\%\) Estimated price change: about +22.95% Takeaway: duration does the heavy lifting; convexity adds the extra juice for a large move.
KEY RATE DURATION
MEMORISE
- Key rate duration = sensitivity to one maturity point on the curve.
- Use it when the curve twists, steepens, or flattens.
- The weighted sum of portfolio key rate durations equals portfolio effective duration.
- This is the “where on the curve am I exposed?” tool.
- Key rate duration is just partial duration. Instead of shocking the whole curve, you shock one maturity point, like the 5-year point, and ask how much the bond price cares about that one spot.
- If the 2-year rate jumps, the 30-year rate barely moves, and the 10-year point falls, key rate duration lets you map the damage properly.
- A portfolio’s key rate durations tell you where the real risk lives across the curve. If your exposure is concentrated in the belly, that is where the pain or gain will come from.
- The weighted sum of a bond portfolio’s key rate durations equals the portfolio’s effective duration. So key rate duration is not replacing effective duration; it is breaking it open by maturity bucket.
HOW EACH DURATION MOVES WHEN BENCHMARK YIELDS MOVE
Core Idea
Duration is the slope between a bond's price and a small yield change.
What is duration: price sensitivity to yield.
What is yield: the market's required interest rate.
Relationship: yield up usually means price down; yield down usually means price up. The hard part is that the slope can change when the bond's cash flows can change.
What is yield curve?
A yield curve is the set of yields for different maturities.
What is yield curve: interest rates lined up by loan length, such as 2-year, 5-year, 10-year, and 30-year.
What is maturity: the final repayment date.
How does it become flat: short and long yields move closer together.
How does it become steep: long yields move much higher than short yields, or short yields fall much more than long yields.
What is benchmark yield: the reference market rate used as the base rate.
What is spread: extra yield above the benchmark for credit or liquidity risk.
Duration Types
Modified Duration
This assumes the bond's cash flows are fixed and measures price sensitivity to the bond's own yield-to-maturity.
Why is modified duration used: to estimate price change for a plain bond when cash flows do not react to rates.
Relationship: if cash flows are locked, only the discount rate moves, so the duration slope stays clean.
Example: imagine you took a fixed-rate mortgage and the lender assumes you will pay every month exactly as scheduled; rate changes affect the loan's value, but not the payment dates.
Effective Duration: Option-Free Bond
This measures price sensitivity to a parallel benchmark-curve shift.
What is option-free bond: a bond with no call, put, or prepayment feature.
What is parallel shift: every point on the curve moves by the same amount.
Why is effective duration used: to measure sensitivity to benchmark-curve movement rather than only the bond's own yield.
Relationship: for an option-free bond, cash flows still stay fixed, so effective duration and modified duration are usually close; they get closer when the curve is flatter, maturity is shorter, and price is closer to par.
Example: imagine your mortgage cannot be refinanced early and all market mortgage rates move up by 1%; the loan value falls much like a normal fixed-rate bond.
Effective Duration: Callable Bond
This falls when benchmark yields fall and the issuer becomes more likely to call the bond.
What is callable bond: a bond the borrower can repay early.
Why is call used: the borrower wants to replace expensive old debt with cheaper new debt.
Relationship: falling yields make refinancing attractive, so the investor loses the long stream of high coupons; expected life shortens, price upside is capped, and effective duration falls.
Example: imagine you borrowed at 7%, new borrowing rates fall to 5%, and you repay early; your lender no longer receives the old 7% payments for as long as expected.
Effective Duration: Putable Bond
This falls when benchmark yields rise and the investor becomes more likely to put the bond back to the issuer.
What is putable bond: a bond the investor can sell back to the borrower before maturity.
Why is put used: the investor wants protection when market rates rise and the old bond becomes unattractive.
Relationship: rising yields normally hurt bond price, but the put creates a floor because the investor can exit; price falls less, so effective duration falls while effective convexity remains positive.
Example: imagine you are the lender and your loan contract lets you force repayment when better market rates appear; you are not trapped earning the old low rate.
Effective Duration: MBS
This changes because mortgage borrowers can refinance or prepay when rates move.
What is MBS: a bond backed by a pool of mortgages.
What is prepayment: borrower pays back principal earlier than scheduled.
Why is refinancing used: the borrower replaces an expensive mortgage with a cheaper one.
Relationship: falling rates increase refinancing, so high-rate mortgage cash flows vanish early; the MBS price does not rise as much as a normal bond, and effective duration captures that changed cash-flow path.
Example: imagine you took a mortgage at 7%, rates fall to 5%, and you refinance; good for you, but the MBS investor loses the attractive 7% payments.
Key Rate Duration
This measures sensitivity to one maturity point on the benchmark curve.
What is key rate: one selected maturity point, such as the 2-year, 5-year, 10-year, or 30-year yield.
Why is key rate duration used: to measure non-parallel curve moves.
Relationship: if only the 5-year yield moves, a full-curve duration hides the detail; key rate duration shows which maturity point created the gain or loss, and all key-rate buckets sum to effective duration.
Example: imagine 30-year mortgage rates rise but 2-year car-loan rates do not; your exposure depends on which rate your cash flows are tied to.
Empirical Duration
This estimates duration from historical price behavior instead of a clean formula.
What is empirical: based on observed data.
What is analytical: based on a model or formula.
Why is empirical duration used: to capture real-world interaction between benchmark yields, spreads, and bond prices.
Relationship: in stress, government benchmark yields may fall while credit spreads widen; the falling benchmark helps price, but the widening spread hurts price, so empirical duration for risky credit can be lower than analytical duration.
Example: imagine base mortgage rates fall, but banks become scared of your credit risk and demand a bigger spread; the headline rate move says borrowing should get cheaper, but the spread fights that benefit.
KRD WITH A NON-PARALLEL MOVE
Problem: 50% in a 5-year zero at 5% and 50% in a 10-year zero at 6%. The 5-year yield rises by 50 basis points and the 10-year yield falls by 25 basis points. Estimate the portfolio percentage change.
5-year impact: modified duration \(= 5/1.05 = 4.762\), weighted KRD \(= 2.381\), price impact \(= -2.381 \times 0.005 = -1.19\%\) 10-year impact: modified duration \(= 10/1.06 = 9.434\), weighted KRD \(= 4.717\), price impact \(= -4.717 \times (-0.0025) = +1.18\%\) Net portfolio move: roughly -0.01% Takeaway: one part of the curve can hurt you while another quietly saves you.
EMPIRICAL VS ANALYTICAL
MEMORISE
- Analytical duration = formula or model estimate.
- Empirical duration = history-based estimate.
- For credit-heavy bonds, empirical duration can be lower because spreads often widen when government yields fall in stress.
- Flight to quality breaks naive analytical thinking.
- Analytical duration and convexity are model-based. They come from formulas or repricing frameworks that usually hold spreads constant while the benchmark curve moves.
- Empirical duration and convexity are built from historical data. They ask what bond prices actually did when rates and spreads moved together in the wild.
- This distinction matters a lot for credit risk. In stress periods, government yields often fall because investors flee to safety, but credit spreads widen at the same time because default fears jump.
- So a corporate bond may not rally nearly as much as its analytical duration suggests. Sometimes it may not rally at all. That is why empirical duration can be lower than analytical duration for credit-heavy portfolios.
Example
March 2020 is the real version. COVID panic sent investors stampeding into US Treasuries, so Treasury yields collapsed. But high-yield corporate spreads exploded because default fear suddenly went through the roof. So a junk-bond fund did not enjoy the full “rates are down, bond prices should rise” party. Spread widening punched back hard. That gap between the neat formula and the actual market outcome is why empirical duration exists.
QUICK CHECKS
- Embedded option or prepayment risk? Use effective, not modified.
- Convert basis points to decimals before multiplying.
- Key rate durations are for non-parallel curve moves.
- Portfolio KRDs add up to portfolio effective duration.
- Analytical holds the spread story simpler than reality; empirical lets history talk.
MODULE 60.1: CREDIT RISK
MEMORISE THIS FOR EFFICIENCY
Loss Rate (LR) = PD \(\times\) LGD Spread should equal Loss Rate If Loss Rate > Spread \(\to\) Investor is under-compensated Expected Loss = LR \(\times\) EAD
- Burn this cutoff: BBB− (S&P) = Baa3 (Moody's) is the last investment grade notch, one step down to BB+ = Ba1 and you're in junk. Yields spike and pension/insurance funds are legally out
- Full credit rating ladder in one breath: AAA → AA → A → BBB is safe, BB → B is speculative, CCC → CC → C is distress, D (S&P) or C (Moody's) is already defaulted
- Notation is cosmetic: Moody's uses letters + numbers (Aa1/Aa2/Aa3), S&P/Fitch use letters + symbols (AA+/AA/AA−), they map 1-to-1 within each tier, and Fitch quietly drops the +/− at CCC.
- Ratings lag reality: market reprices risk instantly → ratings update slow → same rating bonds can trade very different yields because market cares about timing of default + recovery, ratings just average expected loss
- Ratings miss hidden/complex risks: litigation, disasters, leverage events (buybacks, acquisitions) are hard to predict → agencies disagree → same bond can get split ratings → uncertainty not fully captured.
- Agencies can be wrong: incentives + model limits → misratings (e.g., pre-2008 MBS) → high-rated names can still collapse → takeaway = don’t outsource thinking, front-run rating changes > reacting to them
- Two spreads, don't confuse them: yield spread = extra return over risk-free benchmark (credit risk proxy), bid-offer spread = dealer buy/sell gap (liquidity risk proxy) - exam questions will test whether you know which one is being referenced
- Bid-offer spread is your liquidity risk meter: wider gap → higher transaction cost → higher liquidity risk, and the drivers are simple - less debt outstanding + lower credit quality + less trading activity → wider spreads
- Stress causes contagion: junk illiquidity spikes in crisis → risk aversion spreads → IG bid-offer spreads widen too even though the credit quality hasn't changed, liquidity fear is contagious
- You can decompose yield spread into credit vs liquidity: calculate yield at bid and at offer → difference is the liquidity component → strip it out to isolate pure credit risk premium
MODULE 61.1: CREDIT ANALYSIS FOR GOVERNMENT ISSUERS
MEMORISE
- Government credit = ability to tax + willingness to pay.
- Reserve currency and strong institutions make sovereign debt much safer.
- Debt to GDP and interest to revenue are the sovereign versions of leverage and coverage.
- Non-sovereign debt splits into government-backed entities, general obligation bonds, and project revenue bonds.
- A company borrows to make profits. A government borrows to run fiscal policy, provide public goods, and fill budget holes.
- The repayment source is different too. A company repays from operating cash flow. A sovereign government mainly repays from taxes, fees, tariffs, and other government revenue. So the core sovereign credit question is: can this government raise cash from its economy, and will it actually choose to pay you?
- That second part matters because sovereign bondholders usually cannot drag a country into a normal bankruptcy process and liquidate assets the way they might with a company. That is the pain of sovereign immunity.
Example
Uruguay gave the classic “soft default” story in 2003. The country was squeezed by a banking crisis and currency collapse, then pushed bondholders into a maturity extension with IMF support. It looked polite on paper, but analysts still treated it as default in substance because investors got delayed payment without enough compensation.
- Sovereigns usually have the lowest credit risk inside their own country because they can tax the whole domestic economy. But “usually” is doing a lot of work there. Emerging and frontier market sovereigns can absolutely default.
QUALITATIVE FACTORS
MEMORISE
- Institutions and policy = can the state govern properly?
- Fiscal flexibility = can it tax, cut, and manage debt sensibly?
- Monetary effectiveness = is the central bank real or just a printing press sidekick?
- Economic flexibility + external status = how strong is the economy and how hard is it to get foreign currency?
- Government institutions and policy come first because if the legal system is weak, corruption is everywhere, data are unreliable, and politics are chaotic, the numbers stop meaning much.
- Fiscal flexibility means the government can actually tighten its belt when needed. It can collect taxes, restrain spending, and run debt without behaving like every boom will last forever.
Example
Romania got an improved outlook from Moody’s in 2021 partly because it looked serious about fiscal consolidation. The country was trying to drag its deficit below 3% of GDP to stay aligned with European Union expectations. That is the sovereign version of “management finally stopped burning cash like idiots.”
- Monetary effectiveness is about whether the central bank can do its job without being bullied by the treasury. More independence means less temptation to print money, juice inflation, and quietly trash bondholders through currency weakness.
- Economic flexibility is really tax-base quality. Big, diversified, competitive economies are easier to lend to because the government has more places to collect revenue from. Small, concentrated economies tied to one commodity or one trading partner are much more fragile.
- External status is where sovereign analysis becomes brutal. If foreign investors trust your currency, hold your bonds, and treat your currency like a reserve asset, life is much easier. If they do not, every foreign-currency debt payment becomes a stress test.
Example
Moldova got hammered after Russia invaded Ukraine in 2022. Inflation rose, exports weakened, energy costs jumped, and the country had to lean on the IMF for immediate external funding. Same idea every time: when you are small, regionally exposed, and short on external buffers, geopolitics hits your credit profile like a truck.

- Reserve currency status is a monster advantage. If the world is happy holding your currency, you can borrow in your own money far more easily and default risk drops sharply.
- If the currency is not fully convertible, capital controls exist, and foreign investors do not want your domestic debt, the sovereign gets pushed toward foreign-currency borrowing or IMF-style support. That is a much more dangerous game.
- One high-yield sovereign trap: a country can look okay domestically but still crack because it cannot find foreign currency when external debt comes due.
QUANTITATIVE FACTORS
MEMORISE
QUANTITATIVE FACTORS: "FEE" → Fiscal, Economic, External - Fiscal strength: debt to GDP, debt to revenue, interest to GDP, interest to revenue. - Economic growth and stability: size, per capita income, growth rate, volatility. - External stability: reserves, external debt burden, and near-term external debt due.
- Fiscal strength is the sovereign version of leverage plus coverage. Debt burden asks how much debt is piled onto the economy or government revenue. Debt affordability asks how much of the country’s income is being eaten by interest.
- Keep the direction straight. Higher debt to GDP is bad. Higher debt to revenue is bad. Higher interest to GDP is bad. Higher interest to revenue is bad.
- Fiscal deficits matter because they tell you whether the debt pile is still growing. A country with high debt and recurring deficits is basically pouring petrol on the fire.
Example
Greece became the poster child in the eurozone crisis. Debt-to-GDP was already ugly, deficits surged after the Global Financial Crisis, and spreads versus Germany exploded. The nasty twist was that euro-area members could not just devalue their own currency to escape the pressure.

- Economic growth and stability matter because large, rich, diversified economies can absorb shocks better. Bigger GDP and higher per capita income usually mean a fatter cushion.
- Growth volatility matters too. A country growing fast but lurching all over the place is less comforting than one growing a bit slower but steadily.
Example
Vietnam is a nice reminder that rating agencies do not look only at today’s income level. It had lower ratings than some Southeast Asian peers, but strong and stable growth helped support upgrades over time.
- External stability is about foreign-currency survival. Can the country generate or hold enough foreign currency to pay external debt and other obligations to outsiders?
- Currency reserves are the first shock absorber. More reserves relative to GDP or external debt usually means more breathing room.
- But reserves alone can fool you. You also need to look at the structure of exports, remittances, current account behavior, and how dependent the country is on one commodity or one external funding source.
Example
Zambia blew up in 2020 after copper weakness, a falling currency, rising inflation, and a huge jump in external debt. Its reserves collapsed versus external debt, and then the Eurobond default arrived. That is the ugly emerging-market recipe: commodity pain + weak currency + rising foreign debt = disaster.
NON-SOVEREIGN GOVERNMENT CREDIT
MEMORISE
- Agencies and policy banks often sit near the sovereign because support is explicit or strongly implied.
- General obligation bonds are backed by broad tax revenue.
- Revenue bonds are backed by one project’s cash flow.
- GO usually feels safer than revenue because one project can disappoint badly.
- Non-sovereign government debt is a broad bucket. It includes agencies, public banks, supranationals, and regional or local governments.
- Agencies and policy banks often trade close to sovereign risk because the market assumes the government will step in if things get ugly, especially when support is explicit in law.
Example
Germany’s KfW is the clean version of this. It is a development bank backed by an explicit statutory guarantee from Germany, so its bonds sit right up near sovereign quality rather than feeling like ordinary corporate bank debt.
- Regional and local governments are different. They can raise taxes and fees, but they do not control national monetary policy and they do not have full sovereign power. So their rating is usually equal to or below the sovereign, not above it.
- General obligation bonds are backed by the issuer’s general tax and revenue base. Revenue bonds are backed by one project, like a toll road, airport, or rail line.
- That means revenue bonds are naturally riskier because the repayment source is narrower. If the project underperforms, the bond feels the pain directly.
Example
Detroit’s 2013 bankruptcy is the unforgettable general-obligation warning. The city’s tax base got crushed after decades of population decline and industrial decay, leaving it unable to handle roughly USD 18 billion of obligations. Even a government-style issuer can crack when the tax base evaporates.

- A revenue bond is much closer to a project-finance story. You care about usage, pricing power, operating costs, covenants, and debt service coverage ratio, not just broad tax capacity.
Example
Lima Metro Line 2 shows the hybrid style. The project was financed with bonds tied to milestone-based government-supported payments. So you are not just analyzing “Peru the sovereign.” You are analyzing project progress, payment mechanics, and the government backstop together.
MODULE 62.1: CREDIT ANALYSIS FOR CORPORATE ISSUERS
MEMORISE THIS
- Higher profitability, higher coverage, and higher liquidity help creditworthiness.
- Higher leverage hurts creditworthiness.
- Stable cash flows + low business risk + less competitive pressure = more debt capacity.
- Secured debt usually has lower loss given default than unsecured debt.
- Issue ratings adjust issuer ratings for collateral, seniority, and subordination.
- Corporate credit analysis is just one question in plain English: will this company generate enough cash, on time, to pay me interest and principal without drama? If the answer looks shaky, the bond is risky even if the company looks glamorous on the surface.
- Don’t think like an equity investor here. Equity asks, “How much upside can this company create?” Credit asks, “How safely can this company avoid messing up my repayment?” Same company, different lens.
QUALITATIVE AND QUANTITATIVE FACTORS
MEMORISE
QUALITITATIVE FACTORS Inside → Outside → Battlefield → Command. 1. Business model → How does this company make money? (inside the firm) 2. Industry structure → What field does it operate in? (outside the firm) 3. Competitive position → Where does it stand vs rivals? (zoom into battlefield) 4. Governance → Who controls it? (The command layer)
QUANTITATIVE FACTORS "PLLC" → "Please Lend Liquid Cash"
Profitability → Leverage → Liquidity → Coverage
- Stable and predictable cash flows make lenders comfortable. If sales bounce around wildly, debt becomes dangerous because coupons do not care that this year was “a bit weak.” They still want to be paid.
- Low business risk and weaker competitive pressure support more debt capacity. If the business is in a brutal knife-fight industry with constant disruption, lenders get nervous because future cash flows are harder to trust.
- Time horizon matters. Short-dated debt mainly cares about near-term liquidity. Long-dated debt cares much more about whether the whole business model still works years from now.
- For qualitative analysis, hammer four things: business model, industry structure, competitive position, and corporate governance. If any one of these is rotten, the ratios can look fine right before they stop looking fine.
- Business model first: ask yourself where the cash really comes from and whether it is repeatable. A company with boring, repeat customers is usually much easier to lend to than one betting the whole future on a big strategic pivot.
- Industry and competition next: high barriers to entry usually help creditors because they reduce competitive chaos. Higher threat of substitutes, stronger buyers, and faster disruption all make repayment less dependable.
- Governance matters more in credit than people think. If management loves debt-funded buybacks, debt-funded acquisitions, aggressive accounting, or treating bondholders like they are optional, that is a warning sign.
- Accounting red flags are not “equity-only” problems. Opaque reporting, off-balance-sheet financing, capitalizing too much, recognizing revenue too early, or frequently changing auditors can all hide credit weakness until it is too late.
Example
Wirecard was a German payments company that looked like a superstar: fast growth, huge hype, polished story. Then came the horror twist: auditors could not verify EUR 1.9 billion of supposed cash. Translation: the money was basically a ghost. The stock got wrecked, the bonds collapsed, and the company went insolvent. That is why ugly accounting is a credit bomb, not a side note.

- Quantitative credit analysis boils down to four buckets: profitability, leverage, coverage, and liquidity. Profitability asks whether the engine earns enough. Leverage asks how much debt is sitting on top of that engine. Coverage asks how comfortably earnings can handle fixed charges. Liquidity asks whether the company has cash or committed funding right now.
- Profitability helps both shareholders and debtholders. Leverage is different: shareholders often like more leverage because it boosts equity upside, but debtholders prefer lower leverage because they are the ones stuck eating the downside first.
- Coverage is your breathing-room ratio. Higher coverage means the company earns far more than it needs for interest and debt service, so one bad year does not immediately become a refinancing panic.
- Liquidity can save a solvent company from dying stupidly. A firm may have assets greater than liabilities and still default if it simply runs out of cash before debt comes due.
- The core credit ratios here are simple: EBIT margin for profitability, EBIT divided by interest expense for coverage, Debt divided by EBITDA for leverage, and retained cash flow divided by net debt as another leverage check. Learn the direction, not just the formula.
- Higher EBIT margin = better. Higher EBIT-to-interest = better. Higher Debt-to-EBITDA = worse. Higher retained cash flow-to-net debt = better. If you forget everything else, do not forget the direction.
- Credit analysts care about trends, not just one snapshot. Falling margins, weakening coverage, and rising leverage are the classic downgrade recipe.
- Compare ratios with peers and with the company’s own past. A Debt-to-EBITDA of 2.5 can be fine in one industry and ugly in another, so context matters.
- Secured debt means the lender has a claim on specific pledged assets. Unsecured debt means the lender only has a general claim on the company’s assets and cash flows.
Example
Royal Caribbean runs giant cruise ships. Then the pandemic hit and the business got punched in the face: ships stopped sailing, cash stopped flowing, and default risk shot up. But lenders still showed up because they were not lending against a fairy tale. They had ships and intellectual property sitting behind the debt. That is the whole secured-debt idea: if the business stumbles, at least there is something real to grab.

- Hard collateral beats soft promises. Tangible assets like property, equipment, inventory, cash, and marketable securities protect lenders better than goodwill, brand stories, or vague strategic optimism.
DEBT SENIORITY
MEMORISE THIS
SECURED TIER (collateral-backed) 1. First lien ← front of the line, best collateral claim 2. Senior secured ← second lien 3. Junior secured ← weakest collateral claim
UNSECURED TIER (no collateral)
- Senior unsecured ← top of the unsecured pile
- Senior sub ← "senior among the subs"
- Subordinated ← middle sub
- Junior sub ← last to get paid, first to lose
- Seniority decides who eats first in bankruptcy. The rough order is: first lien or first mortgage, then second lien, then senior unsecured, then subordinated, then junior subordinated, and only after that equity.
- This is why two bonds from the same company can have different issue ratings even if the company’s default risk is the same. Same company-level probability of default, different likely loss if default happens.
- Issuer rating usually lines up with the company’s senior unsecured debt and speaks to overall creditworthiness. Issue rating zooms in on one specific bond and adjusts for things like collateral and subordination.
- That adjustment is called notching. If a bond is secured, it may get notched above the issuer rating. If it is subordinated, it may get notched below.
Example
Royal Caribbean gave a beautiful real example. Moody's rated the company itself at B1, its new unsecured notes at B2, and its senior secured notes at Ba2. Same company, but the secured notes got lifted and the unsecured notes got pushed lower because recovery prospects were different. That rating gap is notching in action.
- High-quality issuers often have only small notching differences because default itself is less likely. For lower-rated issuers, notching matters more because if default happens, recovery differences suddenly become a very big deal.
- Recovery rate is how much you expect to get back after default. Loss given default is the flip side. One minus recovery rate gives you loss given default.
- Expected loss ties the whole thing together: Expected Loss = Probability of Default × Loss Given Default. So if default risk is the same, the bond with worse recovery is still the riskier bond.
- Equal seniority means equal class in bankruptcy. Two senior unsecured bonds of the same issuer rank pari passu, so maturity does not move one ahead of the other in the queue.
- One subtle exam point: a secured lender has first claim on the pledged asset, but if the collateral is not enough, the shortfall usually becomes a senior unsecured claim.
- Structural subordination is another trap. Debt issued at an operating subsidiary is serviced by that subsidiary’s cash flows before money can be pushed up to the holding company, so holding-company debt can recover less even if both are called “senior unsecured.”
Example
Caesars is a cleaner structural-subordination story. Caesars Entertainment Operating Company, the casino operating subsidiary, carried a huge pile of debt and entered restructuring talks with its own first-lien and second-lien creditors. The parent holding company sat above it. So if you lent to the parent, you were one floor higher and one step farther from the casino cash flows and assets. That is structural subordination: same group, but the subsidiary creditors get fed before value can travel upstairs.

MODULE 64.1: ASSET BACKED SECURITIES
- Compared to ordinary bank bonds, covered bonds are safer because your repayment isn’t riding on just “the bank stays healthy.” You also have a legally protected pile of assets sitting behind the bond. If assets fail to pay, you can lay claim on the assets of the originator. The covered bonds have a recourse to the originator.
- In a covered bond, the bank still owns the loans (they stay on its balance sheet), so regulators still treat them as the bank’s assets/risk. So the bank must still hold the same capital buffer against them-unlike securitization, where selling/isolating the loans can reduce required capital.
- There is no tranching in covered bonds and the collateral pool cannot contain non performing assets.
- Hard Bullet Suppose issuer misses Year 2 coupon Under hard bullet, this is immediate default. Acceleration happens immediately. The bondholders’ claim becomes: “pay me everything outstanding now."
- Soft-bullet: if the issuer can’t pay at maturity, default/acceleration is delayed by extending the maturity (e.g., up to a year) to give time to pay, and only if still unpaid after the extension does default kick in.
- Conditional pass-through: if anything is still unpaid at maturity, the bond switches to pass-through, meaning investors get paid only as cash is later collected from the cover pool (e.g., 60 now, then 25, then 15), with repayment timing driven by recoveries rather than a fixed date.
WATERFALL STRUCTURE IN ABS
ORIGINATOR (BANK)
   |
   | Sells loans to.
   | This is a true sale including
   | claim on collateral
   v
SPECIAL PURPOSE VEHICLE (SPV)
    |
    | Issues ABS to investors
    v
    Flow of Funds works like this:
    --------
    SENIOR TRANCHE (AAA)
    FV = 300
    MRR + 0.5%
    --------
    MEZZANINE TRANCHE (BBB)
    FV = 80
    MRR + 1.5%
    --------
    JUNIOR TRANCHE (BB)
    FV = 30
    Variable
- The senior tranche has the first claim on cash flows from the underlying assets, so it has the lowest risk and lowest yield. **It can have a higher credit rating than originator"
- Suppose I have 10 of Mezzanine tranche and MRR is 4%. In no default case; I get 10 * 0.055 = 0.55.
- Suppose there is a default in the pool that amounts to 50, then the Junior tranche will be wiped off (30). I have to pay for remaining 20 from Mezzanine tranche. So I get 80 - 20 = 60. My return is 60/80 = 75% of 0.55 = 0.4125.
- Credit card ABS has two phases because credit cards don’t have a fixed “repay schedule” like a mortgage. So the deal first runs a revolving/lockout period where principal coming in is re-lent (investors get only interest/fees), then switches to an amortization period where principal is returned to investors. (Very similar to a Z-Tranche)
COLLATERALISED DEBT OBLIGATION
- A CDO is an SPE-issued box that owns a portfolio of debt and then slices the cashflows into tranches (senior/mezz/equity). What makes many CDOs different from plain ABS is that the portfolio is often actively managed: a collateral manager can buy/sell/reinvest the collateral to keep the deal generating enough cash to pay investors.
HOW CDO's WORK?
- Collateral (loans/bonds) generates interest + principal.
- Cash goes through a waterfall: expenses/fees → senior interest/principal → mezz → equity (residual).
- If defaults happen, losses eat through subordination bottom-up.
- Because a manager can trade/reinvest, future cashflows depend on:
- credit outcomes of holdings, and
- manager’s ability to maintain portfolio quality + comply with deal test
MODULE 65.1: MORTGAGE-BACKED SECURITY (MBS) INSTRUMENT AND MARKET FEATURES
- Prepayment Risk: You own a callable bond (and interest rate falls) → They prepay and buy back their now cheaper bond issued at a high interest rate. Interest Rate falls to 2% and you take a cheaper loan and payback your expensive loan. For the bond investor, high-coupon mortgage cash flows disappear right when they\u2019re most valuable, that is why a risk.
- Extension Risk: Interest Rate rises, Duration falls and Price falls. Bond sellers (borrowers) won't exercise their call option. Expected cash-flows get extended. The market rate is higher but the bond buyer (investor) keeps receiving scraps from mortgages issued at low rates.
- Contraction Risk: Interest Rate falls, Duration rises and Price rises. Prepayments speed up. Bond sellers (borrowers) will exercise their call option. Cash-flows would arrive sooner than expected.
- Because the prices of MBS reflect expectations for prepayments in low-rate environments, they will not rise as much in response to decreasing interest rates as other fixed-income instruments that do not have an embedded prepayment option.
- Convexity is acceleration of prices with falling rates. Prepayments are friction. When rates fall, you lose the deals you earlier did (bought high coupon mortgages), so price of your MBS doesn't rise proportionally. So traditional FI instruments have +ve convexity and MBS have a -ve convexity
HAMMER THIS INTO YOUR HEAD
Long tranches absorb contraction risk. Short tranches absorb extension risk. People at the front of the queue hate delays (so they have to absorb extension), people at the back don't care because they were anyway waiting.
- A mortgage pool pays principal into two tranches: Tranche S (short) first, Tranche L (long) later.
- When payments speed up, principal rushes in. Tranch S is unaffected (it was already on the front line to get paid off). The contraction risk gets pushed to back of the line Tranch L.
- When payments slow down (rates rise), prepayments stagnates. Tranch L is unaffected (it was already on the back of the line to get paid off). The extension risk hurts the front of the line.
- If I take a loan of $100 against and pledge my asset of $200, my Loan to Value (LTV) is 200/100 = 2.
- A mortgage of USD 300,000 has an annual interest rate of 6%, is to be repaid monthly over 25 years, and the borrower’s annual pretax gross income is $80,000. Calculate DTI. Here, PV=-300,000, FV = 0, N = 25�12 = 300, I/Y = 6/12 = 0.5. This gives PMT = 1932. DTI = (1932 * 12) / 80000 = 0.289 ~ 28.9 %
- Prime loans are made to creditworthy people, subprime loans are made to broke people.
- Residential mortgages are different because you can\u2019t freely prepay. If you do, you pay a penalty,. They can be recourse or non-recourse: in recourse loans, the lender can come after your other assets; in non-recourse, they\u2019re stuck with just the house.
- A 30-year US home loan that meets standards gets pooled and guaranteed by Fannie Mae or Freddie Mac. These Agency RMBS are backed either directly by the government or by government-sponsored agencies (quasi-government companies). Credit risk is basically off your plate. Non-agency RMBS: private-issued, no government/GSE backstop → investors eat credit risk. 2008: subprime RMBS (e.g., Lehman Brothers) blew up; defaults surged, protections failed, MBS holders lost money.
- Mortgage pass-through = claim on cash flows from a pool of mortgages, net of admin fees. Pool can have any number of mortgages; each is a securitized mortgage.
- Mortgage A has an outstanding principal of USD 80, a coupon rate of 6%, and a final maturity of 30 years. Mortgage B has an outstanding principal of USD 20, a coupon rate of 4%, and a final maturity of 15 years. Total outstanding principal in the pool is USD 100. Weighted average coupon (WAC) = (80/100 � 6%) + (20/100 � 4%) = 5.6%. Weighted average maturity (WAM) = (80/100 � 30) + (20/100 � 15) = 27 years.
DO NOT MAKE THIS MISTAKE
Outstanding and NOT beginning principal, while calculating weights.
- A Collaterized Mortgage Obligation (CMO) is a tranched MBS. The underlying cash flows are the same mortgages. What changes is how those cash flows are split and ordered. Senior tranche gets paid first and lowest tranche gets paid the last. Total prepayment risk stays the same; it is redistributed across tranches.
- Z-tranche = a CMO tranche that gets no cash interest at first. During this phase, interest is not paid out; it is added to principal instead. Suppose Start: principal = USD 100, coupon = 5%. End of year: no cash paid, principal becomes USD 105. You didn\u2019t get money; your claim just got bigger.
- So the bond grows silently while other tranches take the cash. After the accrual period, Z-tranche starts receiving normal interest and principal payments. Z-tranche is usually last in line. It sacrifices early cash so other tranches get paid first.
- Principal-only (PO) securities and Interest-only (IO) securities are interest-rate / prepayment bets, not boring bonds. - If rates fall, people refinance → prepayments speed up.
-
You get only interest payments, no principal. You want loans to stay alive as long as possible. If rates rise or stay high → prepayments slow → more coupon checks. Used by investors who want to bet on rising/stable rates and slow prepayments.
-
Principal comes back faster, IRR shoots up.
HEDGE FUNDS
- Commingled funds = multiple clients\u2019 money pooled together and invested as one portfolio; each client owns a proportional share, not specific securities. Eg: Mutual Fund
- SMA = one client, one portfolio. Not pooled. You directly own the securities. Risk preferences can be tailored. Higher than commingled funds due to customization and admin.
- Hedge Fund Strategies: A convertible bond = bond floor (interest + principal) + call option on stock. Buy ₹1000 convertible of XYZ paying coupons + right to convert into shares. Short XYZ stock in the right ratio (delta-hedge). Example: If bond acts like 0.4 shares, short 0.4 XYZ.
- Fund-of-funds is a hedge fund invested in multiple hedge funds. Fee layering = you pay fees twice in a fund-of-funds: once to the FoF manager, again to the underlying hedge funds.
- �Under a '1 or 30' fee structure, the manager receives the greater of a 1% management fee or a 30% incentive fee on the fund's alpha.
- Kinds of Fees at Hedge Fund
- Management fee: Fixed annual fee (e.g., 2% of AUM) paid regardless of performance → covers salaries, rent, survival.
- Incentive (performance) fee: Share of profits (e.g., 20%) paid only if fund makes money.
- Hurdle rate: Minimum return (e.g., T-bill or 5%) the fund must beat before incentive fees apply → no reward for just market drift.
- High-Water Mark (HWM): Highest NAV ever reached; incentive fees are paid only on gains above the previous peak → manager must first recover losses before earning again.
- Convertible arbitrage fixed income strategy: \u201cArbitrage\u201d here is: market price of convertible \u2260 price of (bond + call). You buy the convertible bond (which acts like a stock with a safety net). Suppose the bond is selling for 100 and convertible at 95 (safety net). And short the actual stock to cancel out market direction. When prices go up bond gains value faster (convexity) than your short stock loses it. When prices go down, your bond holds value (bond floor protection) while your short stock soar.
- Hedge Fund Index performance is overstated:
- Because of survivorship bias: Most hedge fund don't survive and indexes are constructed only on functioning ones.
- Because of selection bias because indexes have their own constraints for which fund to include and which one not to include.
- Backfill Bias: A hedge fund operates privately at first so its early returns are invisible to databases; if those early returns turn out good, the manager chooses to join a data
base and backfills only that strong past performance, while funds with weak early results never join at all→so the recorded history ends up showing only winners and systematically overstates true hedge-fund returns.